|
|
 |
|
| |
|
| Deterministic Packet Marking for Congestion Price Estimation |
| |
Student: Richard Thommes, Ph.D. Student
Supervisor: Prof. Mark Coates
Abstract: Click here
Conference Paper:
IEEE Infocom 2004 (Hong Kong)
Background:
- The price of a link is a measure of its level of congestion.
- Price-based congestion control schemes require estimates of the total cost of a path - the sum of the individual link prices.
- Addition of two-bit Explicit Congestion Notification (ECN) field in IP header provides routers with a mechanism for conveying price information.
- Two probabilistic marking proposals - Random Additive Marking (RAM) and Random Exponential Marking (REM) make use of ECN.
- These algorithms allow a receiver to estimate path price from fraction of marked packets.
Research Problem:
Devise a deterministic marking algorithm that allows routers to encode link price information and a receiver to estimate the total path price.
Algorithm Specification
- Each of the n routers calculates a b-bit quantization of its outgoing link price.
- Each IP packet carries the sum of 2 equally significant bits of 2 link prices.
- The required number of unique packet types m - referred to as probes - is
 . .
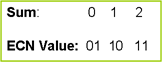
- The sum is encoded as 1 of 3 codepoints in the 2-bit ECN field in IP header:
- The IPid field value is used by the routers to determine the probe type corresponding to a given IP packet: ProbeType = IPid mod m.
- Each router calculates its LinkID for an incoming packet using the TTL field: LinkID = TTL mod n.
- A router uses {ProbeType, LinkID} to determine whether to modify the ECN field of a given packet.
Results
 |
 |
 |
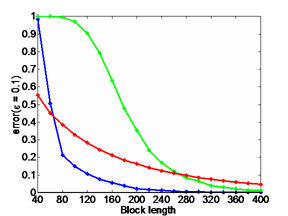
| PLOT 1: Error Probability vs. Block Length |
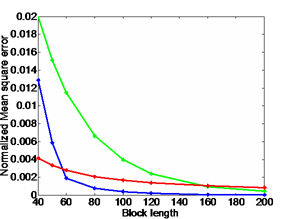
PLOT 2: Normalized MSE vs. Block Length |
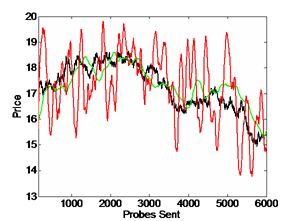
PLOT 3: Estimation of Time-Varying Prices |
- The block length refers to the number of probes used to estimate the
price
- For all plots:
- b = 4
-
green = deterministic algorithm using
randomly generated probe types
-
red = RAM
- Plots 1 and 2:
- blue = deterministic algorithm using probe types
generated from Internet traces
- Plot 1:
- 10 links, each with a constant price, uniformly distributed in (0.4, 0.6)
- Illustrates probability of path price estimate not falling within 10% of
the actual price
- Plot 2:
- 20 links, each with a constant price, uniformly distributed in (0, 1)
- Error normalized by the number of links
- Plot 3:
- 30 links, with each price following a random walk changing after every 50
probes
- black = actual path price
- Estimates represent an exponentially decaying weighted average
|
|
|
|


 Return to Network Pricing Projects